iAspirants
Changing Trends in Cyclonic Disturbances
Published on:
Share this post
Article Summary
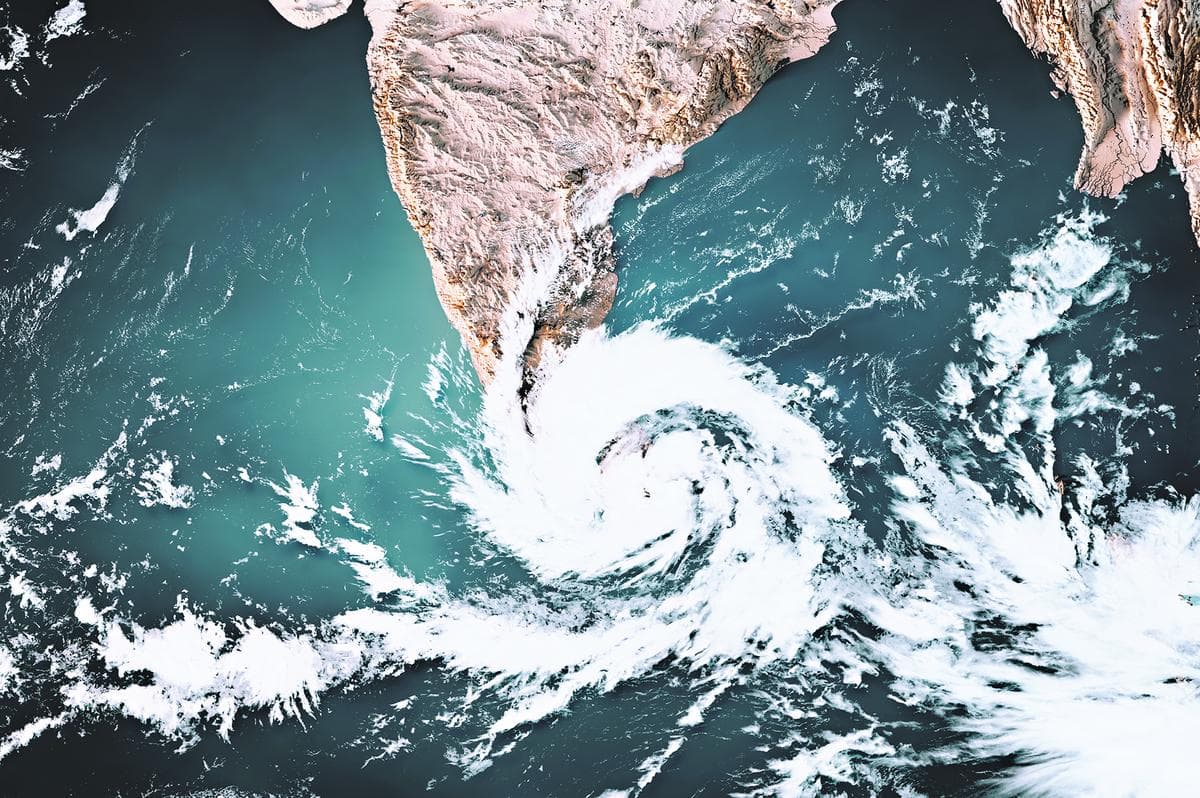
Summary of Cyclonic Disturbances in the North Indian Ocean
Trends in Cyclonic Disturbances
Frequency:
- Historical data indicates a significant change in the frequency of cyclonic disturbances from 1900 to 2025.
- 10-Year Rolling Average:
- Early 1900s (1900-1920): Below 10 disturbances.
- 1930s: Surged over 15 disturbances, leading to stability until the 1970s.
- Declined sharply in the 1980s and 1990s, reaching a low of 8 in the 2000s.
- Recent rebound in the 2010s, current levels still lower than mid-century peaks.
Origin of Disturbances:
- Bay of Bengal: Primary cradle of disturbances, currently experiencing a decline in activity.
- Arabian Sea: Increased activity noted, with fewer disturbances but a rising trend.
Intensity and Severity:
- Disturbances have become more severe over the years.
- Classification of disturbances:
- Low-pressure area: Winds <31 kmph.
- Depression: 31–49 kmph.
- Deep Depression: 50-61 kmph.
- Cyclonic Storm: 62-88 kmph.
- Severe Cyclonic Storm: 89-117 kmph.
- Very Severe: 118-166 kmph.
- Extremely Severe: 167-221 kmph.
- Super Cyclonic Storm: ≥222 kmph.
- Notable increase in the percentage of disturbances that intensify to severe cyclonic storms.
Seasonality Changes:
- Shift in origin of disturbances towards the fourth quarter (October-December) rather than traditional peak months of July-September since the 1980s.
Environmental Context
- Ocean Temperature:
- The Arabian Sea is experiencing significant warming, which contributes to increased cyclone intensity and unpredictability. Warmer ocean temperatures provide more energy to tropical storms.
Data Sources
- The data presented is sourced from the Cyclone eAtlas by the India Meteorological Department, highlighting the scientific basis for the trends observed over the past century.
Implications
- The trends in cyclonic disturbances are crucial for disaster preparedness and response planning, indicating changing weather patterns that need to be addressed by government policies and climate adaptation strategies.
- Enhanced cyclone intensity and changes in seasonality can strain infrastructure and emergency services, requiring updates to existing disaster management frameworks.
Relevant Policies and Actions
- Governments may need to revise climate policies and disaster management protocols in response to shifting cyclone patterns, focusing on enhancing resilience and reducing vulnerabilities in affected regions.
Key Terms & Concepts
| North Indian Ocean | Region for cyclonic disturbances |
| Bay of Bengal | Primary source of disturbances |
| Arabian Sea | Increasing activity region |
| 10-year rolling average | Trend analysis method |
| 1900-2025 | Timeframe for data collection |
| 10 | Threshold for early disturbances |
| 15 | Threshold for disturbance surge |
| 8 | Low point of disturbances |
| 31-49 kmph | Depression wind speed range |
| 62-88 kmph | Cyclonic storm wind speed |
| ≥222 kmph | Super cyclonic storm speed |
| 1970s | Period for storm intensity rise |
| October-December |