iAspirants
Indian Cities' PM2.5 Pollution Levels
Published on:
Share this post
Article Summary
Air Quality in Indian Cities during Winter 2025-26
Pollution Statistics:
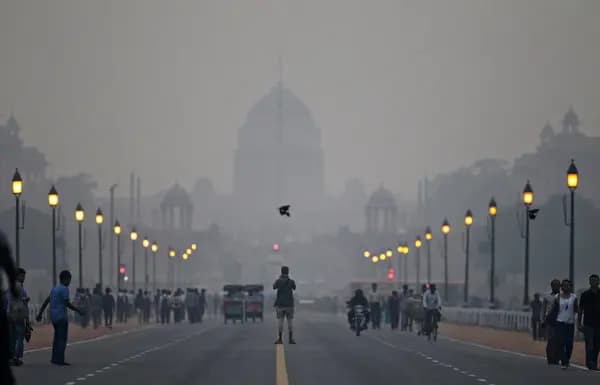
- PM2.5 Levels: 204 out of 238 Indian cities recorded average PM2.5 levels exceeding the Indian standard of 40 µg/m³ as per Central Pollution Control Board (CPCB) data.
- Most Polluted Cities:
- Ghaziabad: 172 µg/m³
- Noida: 166 µg/m³
- Delhi: 163 µg/m³
- Other cities in the top ten included Greater Noida, Bahadurgarh, Dharuhera, Gurugram, Bhiwadi, Charkhi Dadri, and Baghpat. Uttar Pradesh and Haryana had four cities each in the top ten.
Health Implications:
- PM2.5 are fine inhalable particles that penetrate the lungs and bloodstream, associated with respiratory diseases and other health issues.
- None of the analysed cities met the WHO PM2.5 standard of 5 µg/m³.
Comparative Pollution Levels of Megacities:
- Delhi: 163 µg/m³
- Kolkata: 78 µg/m³
- Mumbai: 48 µg/m³
- Chennai: 44 µg/m³
- Bengaluru recorded 39 µg/m³, slightly below the National Ambient Air Quality Standards (NAAQS) limit.
Cleanest Cities:
- Chamarajanagar, Karnataka, was the cleanest city with an average PM2.5 concentration of 19 µg/m³.
- The ten cleanest cities mainly comprised locations in Karnataka, along with cities from Madhya Pradesh and Meghalaya.
Data Source & Methodology:
- Analysis conducted by the Centre for Research on Energy and Clean Air (CREA) using Continuous Ambient Air Quality Monitoring Stations (CAAQMS) data from CPCB for the period of October 1, 2025, to February 28, 2026.
Conclusion
The data highlights significant air quality concerns affecting India's major cities, emphasizing the urgent need for environmental policies aimed at reducing air pollution levels.
Key Terms & Concepts
| PM2.5 | chief pollutant measured |
| Central Pollution Control Board | data provider on air quality |
| Centre for Research on Energy and Clean Air | independent research group |
| 172 g/m³ | Ghaziabad's average PM2.5 level |
| WHO PM2.5 standard | international air quality guideline |
| October 1, 2025 to February 28, 2026 | analysis period |
| NAAQS limit | national air quality standard |
| Chamarajanagar, Karnataka | cleanest city recorded |
| 19 g/m³ | Chamarajanagar's average PM2.5 level |