iAspirants
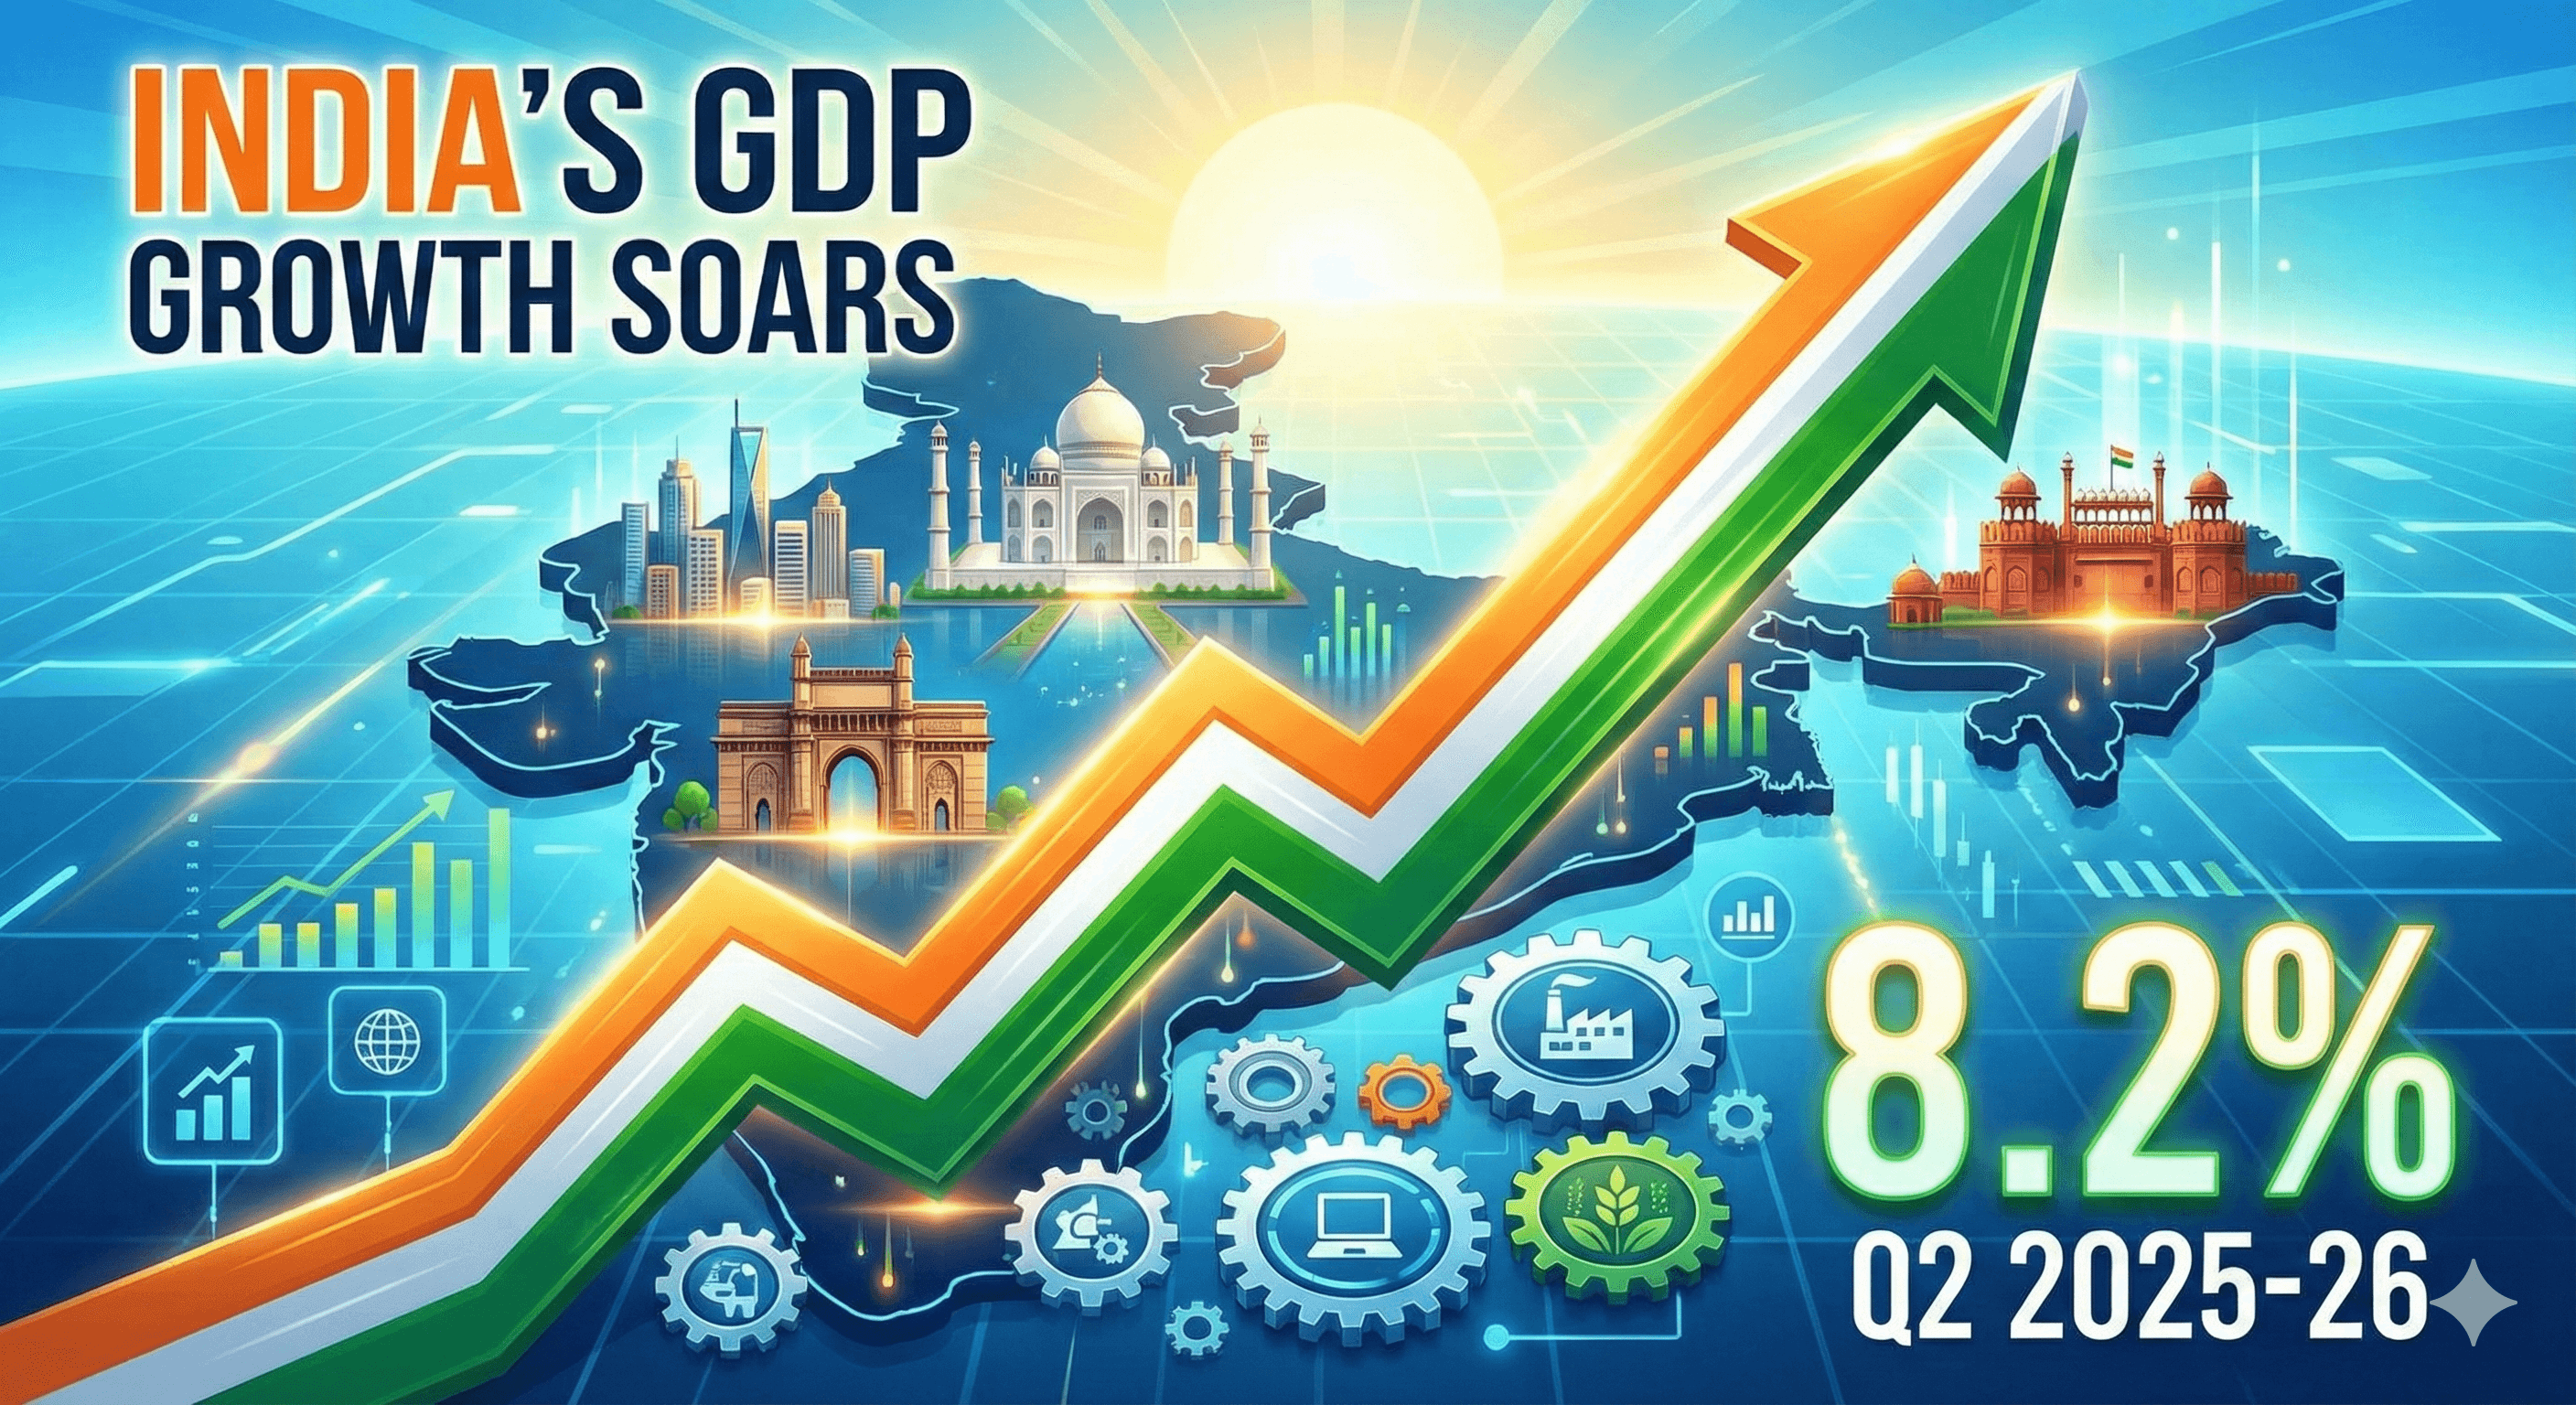
India's GDP Growth Soars to 8.2%
Published on:
Share this post
Article Summary
India Q2 GDP Growth Data Highlights (July-September 2025)
Economic Growth Indicators:
- Real GDP Growth: 8.2% in Q2 FY26, highest in six quarters; compared to 5.6% in Q2 FY25.
- Manufacturing Sector: Expanded 9.1%, compared to 7.7% in April-June and 2.2% in Q2 FY25.
- Construction Sector: Growth at 7.2%, slightly down from 7.6% in April-June 2025.
- Services Sector: Grew by over 9%, with specific components:
- Financial, Real Estate & Professional Services: 10.2%
- Public Administration, Defence & Other Services: 9.7%
- Agriculture Sector: 3.5% GVA growth.
Government Expenditure and Consumption:
- Gross Fixed Capital Formation: Increased by 7.3%, supported by a 31% rise in Government's capital expenditure.
- Private Final Consumption Expenditure: Increased by 7.9%, reflecting the impact of low inflation and GST cuts.
- Government Final Consumption Expenditure: Decreased by 2.7% in Q2.
GDP Projections:
- Economic Forecast:
- Chief Economic Advisor revised GDP growth for 2025-26 to at least 7% (up from previous 6.3-6.8%).
- RBI’s growth forecast at 6.8%, though may be revised upward in MPC meeting post-GDP announcement.
Inflation and Fiscal Indicators:
- Headline Retail Inflation: Record low of 0.25% in October, fuelling speculation for a potential cut in policy repo rate.
- Gross Tax Revenue (GTR): Up 4% in the first seven months of 2025-26; however, GTR buoyancy of only 0.32 against a targeted 1.1.
Relevant Statistics:
- Overall GVA Growth: Increased to 8.1% from 7.6% in the previous quarter.
- Industry Growth: Overall industrial growth at 7.7%, from 6.3%, highlighting stronger manufacturing and service performance.
Structural Insights:
- Economists cite increased public investments, services demand, and industrial output as key growth drivers.
- Notably, risks such as potential impacts from US tariffs were mentioned, indicating economic uncertainty ahead.
Context and Expectations:
- The data comes at a crucial time as the MPC convenes to discuss potential monetary policy adjustments, amid shifting inflation dynamics.
- The economic policies and reforms put in place have been highlighted as contributing factors to these growth figures, suggesting ongoing government commitment to bolstering economic performance.
International Implications:
- The growth figures are critical indicators ahead of any international commitments or comparisons, particularly as global economic conditions might affect future projections.
This analysis outlines a robust performance in the Indian economy during Q2 2025, backed by significant growth in services and manufacturing, highlighting the resilience and potential areas of concern moving forward.
Key Terms & Concepts
| 8.2% | Q2 GDP growth rate |
| July-September 2025 | GDP growth period |
| 6.3-6.8% | Previous GDP growth forecast |
| 9.1% | GVA growth in manufacturing |
| 7.2% | Construction growth |
| 10.2% | Growth in Financial Services |
| 3.5% | Agriculture GVA growth |
| 4% | Gross tax revenue increase |
| 0.32 | GTR buoyancy |
| 22.3% | Needed growth in tax revenue |
| 31% | Rise in Government capital expenditure |
| 7.3% | Gross Fixed Capital Formation growth |
| December 3, 2025 | MPC meeting start date |